

Trips, dwell, utilisation: which KPIs fleets actually need
Which metrics actually count in fleet management: trips, dwell, utilisation, fuel, and how to read them without drowning in a data graveyard.

Which KPIs matter most in fleet management?
For most fleets five metrics suffice: kilometres driven per vehicle, dwell (where and how long), utilisation (used vs available vehicle time), fuel consumption per 100 km, and the number of trips or stops per day. What counts is the trend over weeks, not a single day's value.
Fleet data has a volume problem: modern tracking logs every trip, every stop, every kilometre, and that is exactly where many reports suffocate. The craft is not measuring more, but looking at the right things. This guide shows the metrics with which a fleet can actually be steered, and how to read them.
Why KPIs in the fleet (and why so few)
Without metrics, fleet steering runs on gut feel and individual cases: the vehicle someone last complained about gets attention; the chronically underused one nobody notices. KPIs make patterns visible that stay invisible in day-to-day work.
At the same time: every metric nobody looks at regularly is ballast. A small set of four to six values, checked weekly or monthly, as a trend rather than a daily figure, has proven itself. Individual outliers are normal; what is interesting is what shifts over weeks.
The core KPIs at a glance
1. Kilometres per vehicle. The base metric: how much is actually driven? It comes from the automatic logbook with no extra work. In a fleet comparison it shows uneven distribution: a vehicle with half the kilometres of its peer group deserves a question.
2. Dwell: where and how long. The most underestimated metric, because standing still costs nothing that would appear on an invoice. The stop history shows where vehicle time leaks: recurring long waits at particular customers, ramp times, gaps between jobs. Context matters: an hour at a customer appointment is work, an unplanned hour in the yard is loss. So always analyse dwell by place. Geofencing zones help, see the geofencing guide.
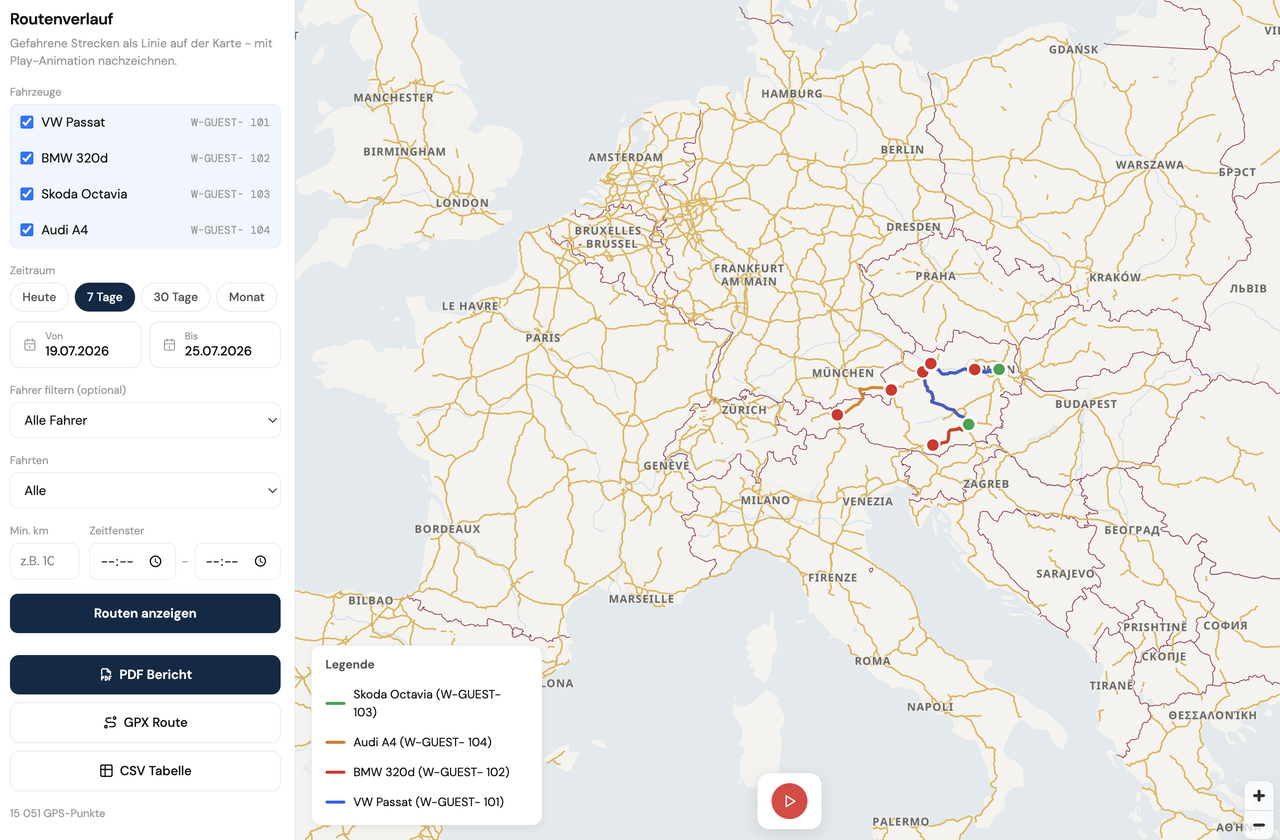
3. Utilisation. The share of actually used time in available vehicle time. This metric answers the most expensive question in the fleet: do we have the right fleet size? If three of twenty vehicles barely move for months, the company is financing parking, insurance and depreciation for a reserve that is not one.
4. Fuel consumption per 100 km. At vehicle level the consumption trend shows technical problems (creeping extra use) and usage patterns. At fleet level it is the basis for cost forecasts. Outliers to the upside are a check, not automatically a reproach: short-trip profiles or payload are often behind them, not driving style.
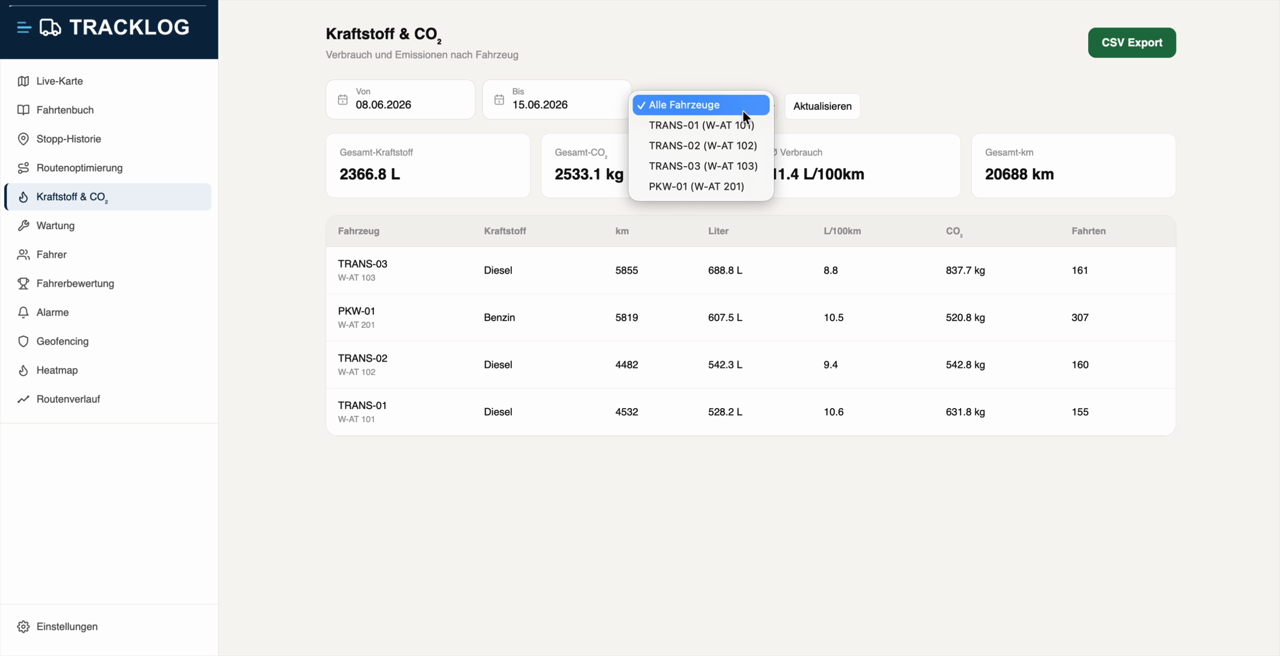
5. Trips and stops per day. The operational tempo: how many assignments does a vehicle complete? If it changes, either order volume has shifted or tour planning has. Combined with dwell it shows whether more jobs would be realistic or capacity is already maxed out.
Analysis: trend beats the daily figure
Three rules turn raw data into usable steering:
Week and month view instead of real-time control. KPIs are a steering tool, not a live monitor. Anyone who digs into individual trips every day loses the trend and creates a feeling of constant surveillance in the team that costs acceptance.
Compare what is comparable. Benchmarking a city delivery van against a long-haul truck produces false findings. Form groups: same vehicle class, similar usage profile.
Every metric needs a consequence. For each KPI it should be clear what happens on deviation: utilisation low → check basing. Consumption rising → workshop check. Dwell at customer X → talk about ramp times. Without a consequence rule, reporting is an end in itself.
From metric to report
What works in practice: a monthly short report with the five core KPIs as a fleet overview plus a list of notables. The data basis (trips, stops, kilometres, consumption) is supplied automatically by the GPS platform; at TrackLog, logbook and reports can be exported as PDF or CSV and passed straight to accounting or management. The full feature set is on the features page.
If you do not yet have an automatic data basis: the guide introducing GPS in the fleet describes the path there in 30 days.
Conclusion
Fleet steering does not need twenty dashboards. It needs five metrics with consequences: kilometres, dwell, utilisation, consumption, tempo. With modern GPS tracking the raw data appears as a by-product; the work is looking at the trend regularly. To build your own data basis: Order now. From 9.90 € per vehicle and month, all reports included.
Frequently asked questions
How many KPIs should a fleet track?
What does the dwell metric tell you?
How do you spot poor vehicle utilisation?
Do you need separate software for fleet KPIs?
See the fleet live. Today.
The device arrives by post. Plugged in in under 1 minute, cancel monthly.
Order now